Computational pathologyDomain generalisationFoundation models · LoRAConformal uncertainty

Mitotic figure counting
that holds up on new scanners

MitoGuard counts dividing cells in H&E tumour images, rejects the look-alike imposter cells that cause most false alarms, and reports every count with a calibrated 90% interval and a grade-ambiguity flag, so a pathologist knows when to look.

0.71 vs 0.51
Detection F1 on unseen scanners (MitoGuard v2 vs YOLO11 baseline)
0.85 vs 0.45
Agreement with pathologist counts (Lin's CCC) on unseen scanners
99.6%
Grade-category accuracy when a region is not flagged
0.754 vs 0.666
F1 on the MIDOG++ paper's test regions, unseen tumour type

Interactive results on held-out test regions

Real MitoGuard v2 outputs on eight regions from the official MIDOG++ test split (7 tumour types, 4 scanners), shown next to the pathologists' consensus labels. Pick a region, then switch layers.

region

Demo model trained on the official MIDOG++ training split; these regions are test-split cases it never saw. Each region is a 1,536 px window (~0.37 mm wide) at 40×.

How it works

Detectors propose, a pathology foundation model decides, and conformal prediction quantifies trust.

pipeline
Stage 1

Imposter-aware candidates

Two YOLO11 detectors with explicit mitosis and imposter classes, trained with and without stain augmentation. They keep both class scores, because on new scanners real mitoses often get filed as "imposter".

Stage 2 · novelty

Cell-centred foundation model

A mitosis covers ~50 of 224 px, so the usual CLS embedding mostly describes the surrounding tissue. Zooming in and reading out the centre patch tokens lifts validation AP from 0.77 to 0.90. Phikon-v2, Phikon and Lunit are then LoRA-fine-tuned.

Decision

Robust to scanner shift

The final call ignores YOLO's confidence, which is the signal that breaks on unseen scanners. An ensemble with 8-view test-time augmentation decides, with Platt-calibrated probabilities (ECE 0.017).

Trust

Intervals + ambiguity flag

Conformal prediction turns the Poisson-binomial count into a 90% interval. If the interval crosses a grade cut-off (≤7 / 8–14 / ≥15), the region is flagged for review.

Results on domains the model never saw

Leave-one-tumour-out (7 folds) and leave-one-scanner-out (4 folds) on MIDOG++ (503 regions, 11,937 mitoses, 14,349 imposters). Nested model selection: a held-out domain never influences its own configuration. 95% CIs from a paired bootstrap.

Held-out F1 [95% CI]YOLO11 baselineMitoGuard v1 (frozen FM)MitoGuard v2
Unseen scanner0.510 [0.467, 0.552]0.5370.714 [0.686, 0.740]
Unseen tumour type0.760 [0.740, 0.778]0.7650.778 [0.758, 0.795]
Count agreement, unseen scanner (CCC)0.450.510.85
Grade-category κ, unseen scanner0.550.560.80
Calibration error (ECE), unseen tumour0.0600.0340.017

per-domain F1
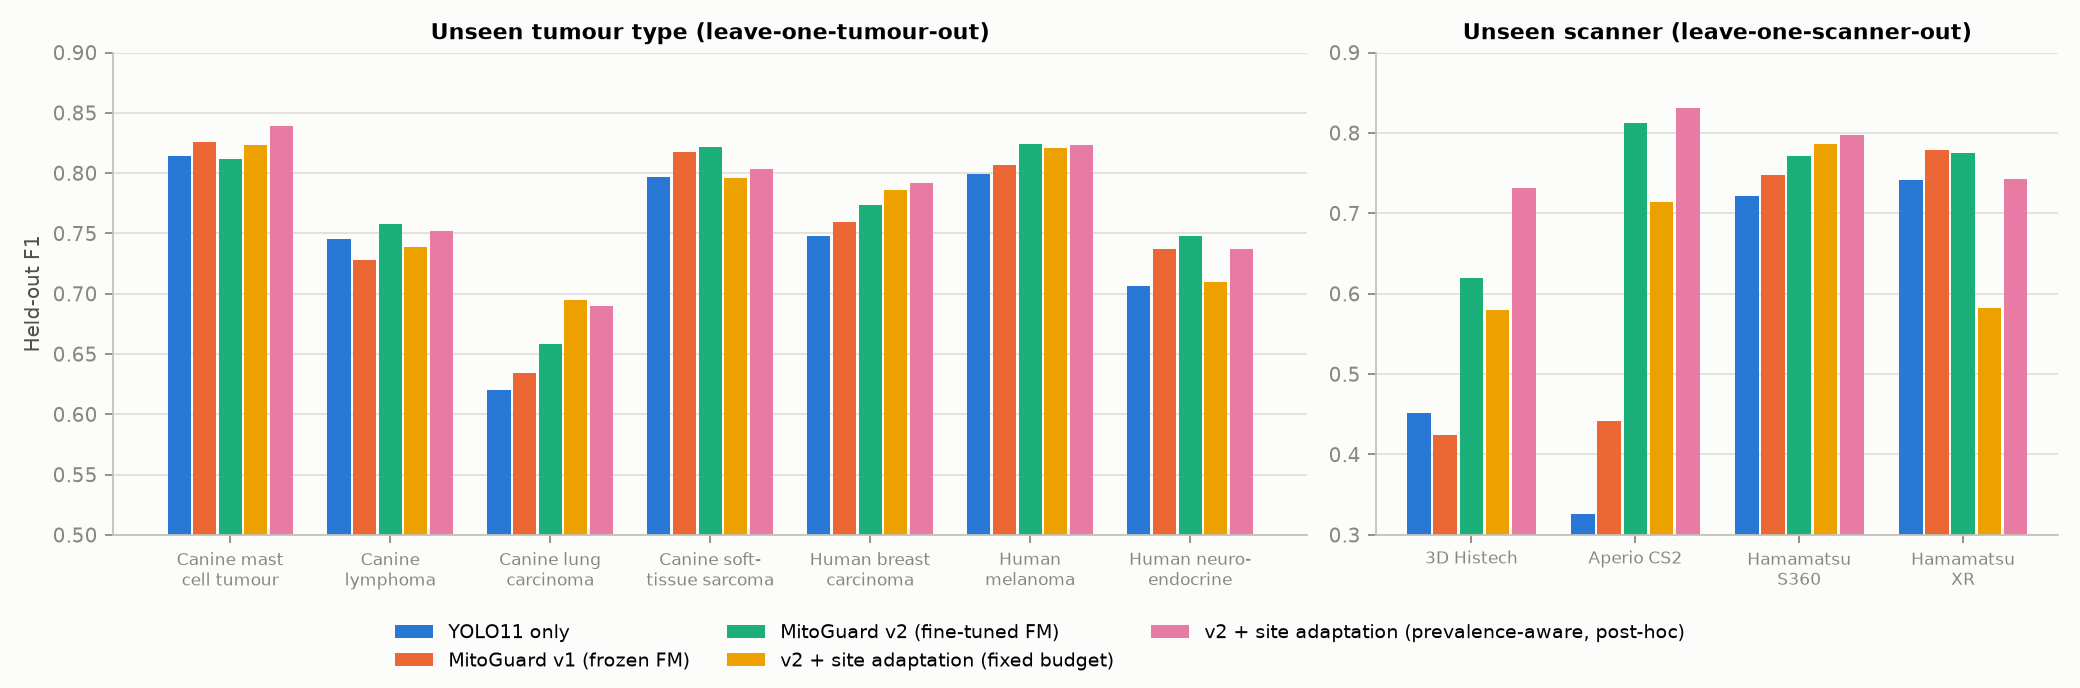
Held-out F1 on every unseen tumour type and scanner. The largest gains come under the strongest shifts (e.g. Aperio CS2: 0.33 → 0.81).

calibration
Probabilities stay calibrated on unseen tumour types.
counts
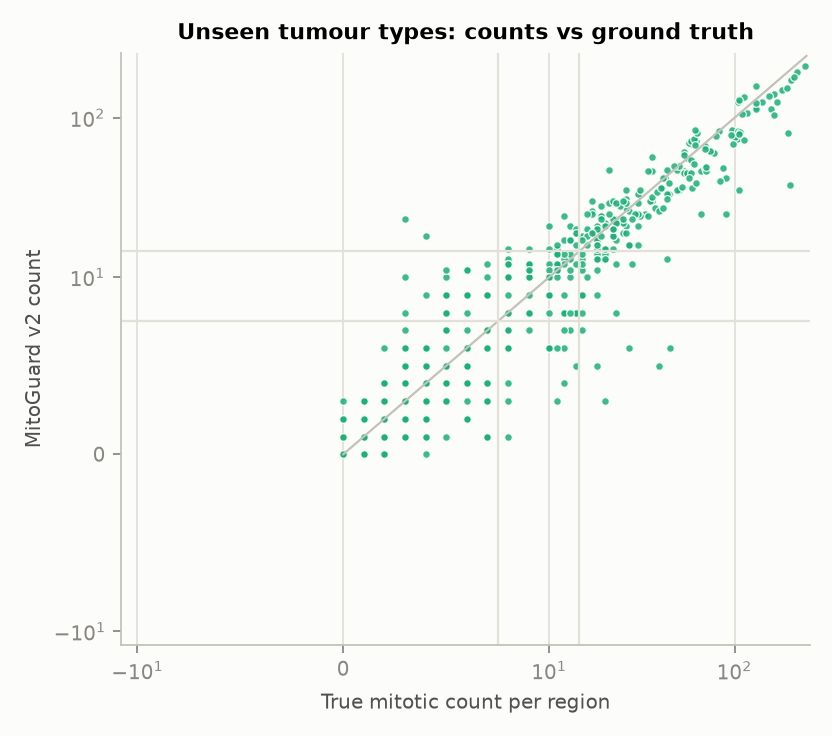
Predicted vs pathologist counts per region (unseen tumour types).

umap
Why it works: foundation-model features are not scanner-invariant (bottom row clusters by scanner), but the cell-centred read-out separates mitoses from imposters consistently across domains (linear-probe AUROC 0.88 vs 0.59 for ImageNet).

External validation and comparison

TUPAC16: 73 breast cancer cases from other labs and scanners, with no tuning at all (thresholds fixed on MIDOG++ validation).

BenchmarkPublishedMitoGuard
TUPAC16 (relabeled), external0.735 (2026, best FM detector)0.754 (v1) · 0.741 (v2)
MIDOG++ unseen tumour, official test regions0.666 (dataset paper)0.754
MIDOG++ in-domain0.719 (dataset paper)0.792
MIDOG++ leave-one-domain-out0.736 (MIDOG 2025 entry)0.771
Honest by design. Every number comes from data the model never saw. Negative results are documented: label-shift correction and YOLO-score stacking hurt under shift, and one self-training variant failed on a low-prevalence site. MIDOG challenge leaderboards use hidden test sets, so no state-of-the-art claim is made.

Full tables, model card and experiment log are in the GitHub repository. Research software, not a medical device.